A Survey and Benchmarks of Intel® Xeon® Gold and Platinum Processors

This paper provides quantitative guidelines and performance estimates for choosing a processor among the Platinum and Gold groups of the Intel Xeon Scalable family (formerly Skylake). The performance estimates are based on detailed technical specifications of the processors, including the efficiency of the Intel Turbo Boost technology. The achievable performance metrics are experimentally validated on several processor models with synthetic workloads.
The best choice of the processor must take into account the nature of the application for which the processor is intended:
- multi-threading or multi-processing efficiency,
- support for vectorization, and
- dependence on memory bandwidth.
Table of Contents
- 1. Which Xeon is Right for You?
- 2. CPU Comparison for Different Workloads
- 2.4. Bandwidth-Limited
- 3. Processor Choice Recommendations
- 4. Silver and Bronze Models
- 5. Large Memory, Integrated Fabric, Thermal Optimization
1. Which Xeon is Right for You?
In 2017, the Intel Xeon Scalable processor family was released, featuring the Skylake architecture. Processors in the Scalable family support Intel Advanced Vector Extensions 512 (Intel AVX-512) (see, e.g., this paper), improved cache and organization and memory technology. As a result, the Scalable family processors deliver better efficiency and higher performance compared their predecessors based on the Broadwell architecture.
While all Intel Xeon Scalable family models use the same socket LGA3647, they possess different sets of features and metrics. This variety makes it difficult to choose the best processor for a given task. While Intel’s documentation provides helpful initial hints, it leaves room for choice and, potentially, error. The goal of this paper is to close this information gap and provide qualitative and quantitative advice for the end user choosing an Intel Xeon Scalable family processor.
1.1. Platinum, Gold, Silver, and Bronze
The Scalable family is organized into four groups of processors: Platinum, Gold, Silver, and Bronze, in the order of decreasing cost, performance and added features. The key quantitative differences between them are summarized below.
- Platinum processors support up to 8-socket configuration and 2666 MHz DDR4 memory. They have two FMA units per core, the performance feature Intel Turbo Boost Technology 2.0, and the reliability feature Intel Run Sure Technology. Some models support integrated fabric (-F suffix), high memory capacity (-M) and optimized thermal profile for a 10-year life cycle (-T).
- Gold processors support up to 4-socket configuration. The 61xx models support 2666 MHz DDR4 and have two FMA units; 51xx models support only 2400 MHz and have one FMA unit per core. The -F, -M and -T models are available. Turbo Boost and Intel Run Sure are present in all models.
- Silver processors support up to 2-socket configuration and 2400 MHz DDR4 memory. All models have one FMA unit per core. The Intel Turbo Boost 2.0 is present in all models. Not available in this group: Intel Run Sure technology, large-memory models (-M) and integrated fabric models (-F).
- Bronze groups processors still support up to 2 sockets, but only up to 2133 MHz memory. One FMA unit per core in all models. Not available: Intel Turbo Boost 2.0, Intel Run Sure, and -F, -M and -T models.
| Group | Cores | Sockets | DDR4 | FMA | Fabric1 | Memory2 | Thermal3 | Turbo | Run Sure |
| Platinum 81xx | ≤ 24 | ≤ 8 | 2600 | 2 | -F models | -M models | -T models | all | all |
| Gold 61xx | ≤ 20 | ≤ 4 | 2600 | 2 | -F models | -M models | -T models | all | all |
| Gold 51xx | ≤ 14 | ≤ 4 | 2400 | 14 | -F models | -M models | -T models | all | all |
| Silver 41xx | ≤ 12 | ≤ 2 | 2400 | 1 | -T models | all | |||
| Bronze 31xx | ≤ 8 | ≤ 2 | 2133 | 1 |
Table 1: Key differences between the four groups of Intel Xeon Scalable processor family.
The DDR4 column lists the maximum supported DDR4 RAM frequency.
1 Integrated Intel Omni-Path Fabric is available only in models with suffix -F
2 Large memory capacity (up to 1.5 TB per socket) in models with suffix -M (normal capacity up to 768 GB)
3 Thermal optimization for a 10-year life cycle in models with suffix -T
4 The Gold 5122 model has 2 FMA units and supports 2600 MHz RAM.
This crude classification may be sufficient to narrow your search down to one or two groups. To find the right processor within a specific group, you should look at the usual metrics: core count and clock frequency. At this point, your choice may seem to be determined by the competition of three factors: the base clock frequency listed in the documentation, the core count, and cost. However, the estimated performance of a chip is more complex than just the number of cores multiplied by the clock frequency. As Section 2 shows, you also need to consider
- The capabilities of the Intel Turbo Boost 2.0 technology,
- The parallelism of your application (thread scalability and vectorization), and
- The impact of memory traffic (compute-bound versus bandwidth-bound nature of your application).
1.2. Turbo Boost
The base clock frequency of a processor listed in, for example, at ark.intel.com, is just the guaranteed frequency for scalar (non-vectorized) workloads when the Intel Turbo Boost 2.0 technology is disabled. However, for most users, it makes sense to enable Turbo Boost. This technology increases the clock speed of individual cores when the thermal, current and power limitations permit it.
Intel has published the maximum Turbo Boost frequencies for a range of Gold and Platinum models in the specification update. According to this publication, Turbo Boost can increase the clock frequency by as much as 85%, depending on the model and the workload. The maximum boost is greater for scalar workloads, lower for AVX2-rich workloads, and lower yet for AVX-512 applications. Furthermore, the maximum Turbo Boost frequency depends on the number of concurrently utilized cores.
Figures 1 through 15 in the specification update show a wealth of data, making it difficult to understand what is relevant. However, this data becomes much more informative when filtered for three most common usage scenarios. Table 2 summarizes the data relevant to these scenarios.
| Model | C | B | TS | TPS | TPV |
| 8180 | 28 | 2.5 | 3.8 | 3.2 | 2.3 |
| 8168 | 24 | 2.7 | 3.7 | 3.4 | 2.5 |
| 8158 | 12 | 3.0 | 3.7 | 3.6 | 2.7 |
| 8156 | 4 | 3.6 | 3.7 | 3.7 | 3.3 |
| 6148 | 20 | 2.4 | 3.7 | 3.1 | 2.2 |
| 6154 | 18 | 3.0 | 3.7 | 3.7 | 2.7 |
| 6150 | 18 | 2.7 | 3.7 | 3.4 | 2.5 |
| 6142 | 16 | 2.6 | 3.7 | 3.3 | 2.2 |
| 6132 | 14 | 2.6 | 3.7 | 3.3 | 2.3 |
| 6146 | 12 | 3.2 | 4.2 | 3.9 | 2.7 |
| 6136 | 12 | 3.0 | 3.7 | 3.6 | 2.7 |
| 6126 | 12 | 2.6 | 3.7 | 3.3 | 2.3 |
| 6144 | 8 | 3.5 | 4.2 | 4.1 | 2.8 |
| 6134 | 8 | 3.2 | 3.7 | 3.7 | 2.7 |
| 6128 | 6 | 3.4 | 3.7 | 3.7 | 2.9 |
| 8176 | 28 | 2.1 | 3.8 | 2.8 | 1.9 |
| 8170 | 26 | 2.1 | 3.7 | 2.8 | 1.9 |
| 8164 | 26 | 2.0 | 3.7 | 2.7 | 1.8 |
| 8160 | 24 | 2.1 | 3.7 | 2.8 | 2.0 |
| 6152 | 22 | 2.1 | 3.7 | 2.8 | 2.0 |
| 6138 | 20 | 2.0 | 3.7 | 2.7 | 1.9 |
| 6140 | 18 | 2.3 | 3.7 | 3.0 | 2.1 |
| 8153 | 16 | 2.0 | 2.8 | 2.3 | 1.6 |
| 6130 | 16 | 2.1 | 3.7 | 2.8 | 1.9 |
Table 2: The clock frequencies of the top 24 models relevant to the most important usage scenarios.
C is the number of cores per socket,
B is the base frequency for scalar workloads (the number that you will find in most documents),
TS is the maximum Turbo frequency for scalar workloads on 1 core,
TPS is for scalar workloads on C cores, and
TPV is for AVX-512 workloads on C cores. Clock frequencies are in GHz.
The next section describes how these data points can help to estimate the performance of a given model.
1.3. Workload Types
Most computational applications fall into one of the following categories:
Serial
Serial applications use only one core. Serial processing often occurs on a CPU used in a workstation when you interact with user interfaces, compile code, or process LaTeX. Additionally, you may need to run legacy applications incapable of multi-threading. These workloads rarely use vector instructions. For this usage scenario, we only need to consider the Turbo Boost frequency for 1 core for scalar workloads from Figures 1 and 4 in the specification update.
Scalar, multicore
These applications use multiple threads or processes to utilize all cores of a CPU, but do not use vector instructions. This scenario occurs, for example, in initial stages of modernization of legacy applications, when threading implemented, but data structures do not lend themselves to vectorization. Multi-threaded Python applications that do not use vectorizing libraries will also run in this mode. Multicore scalar applications also occur when you use concurrent processes performing single-threaded tasks — for example, to compile multiple source code files in parallel (think make -j). For this scenario, the only Turbo Boost frequency that we need is for the maximum number of cores for scalar workloads from Figures 1 and 4 in the specification update. Sub-optimal scalability (fewer than all cores utilized) must be studied separately.
Vector, multicore
Fully optimized applications for parallel processors should scale across all cores and also use the data parallelism inside a core (vector processing). When these applications are limited by the arithmetic performance, they operate near the Turbo Boost frequency for AVX-512 workloads. Even if you are not an expert in performance optimization, you may find yourself using such applications if you rely on tools, libraries, and frameworks optimized for Intel architecture. For example, deep learning applications using Intel Distribution for Python and machine learning frameworks based on Intel MKL fall into this category. For this scenario, the only Turbo Boost frequency that we need is for the maximum number of cores for AVX-512 workloads (Figures 3 and 6 in the specification update).
Figures 2 and 5 in the specification update also provide Turbo Boost frequencies for AVX2 workloads, but I did not include them in Table 2. These frequencies are applicable when you run a vectorized application compiled for Intel Xeon E5 families. As we show in this paper, AVX-512 is an improvement over AVX2, so it does not make sense to use AVX2 on the Skylake architecture. If you can migrate your code to AVX-512 (for example, you are relying on automatic vectorization or libraries with runtime architecture detection, such as Intel MKL), do it. If switching to AVX-512 is not straightforward, it makes sense to invest into code modernization, as it may significantly boost your gain from the Intel Xeon Scalable processors.
Bandwidth-Limited
Some applications are highly parallel and have vector-friendly data structures, but they do not achieve at the peak arithmetic throughput because their performance is limited by the memory bandwidth. Usually, this happens either because the code is not sufficiently optimized for cache utilization or because the operational intensity of the algorithm is not high enough (see, e.g., paper by Williams et al.). If you use applications like this, you likely know about it — this case occurs in fluid dynamics, image processing, quantum chromodynamics and similar stencil-based calculations. To estimate the performance of a bandwidth-limited application on a given CPU model, clock frequencies are useless, and additional benchmarks, such as STREAM, must be performed.
2. CPU Comparison for Different Workloads
2.1. Serial
Figure 1 shows the one-core scalar maximum Turbo Boost frequency plotted against the base frequency. The “performance” group of models features high per-core performance and the “energy” group is optimized for high performance per watt.
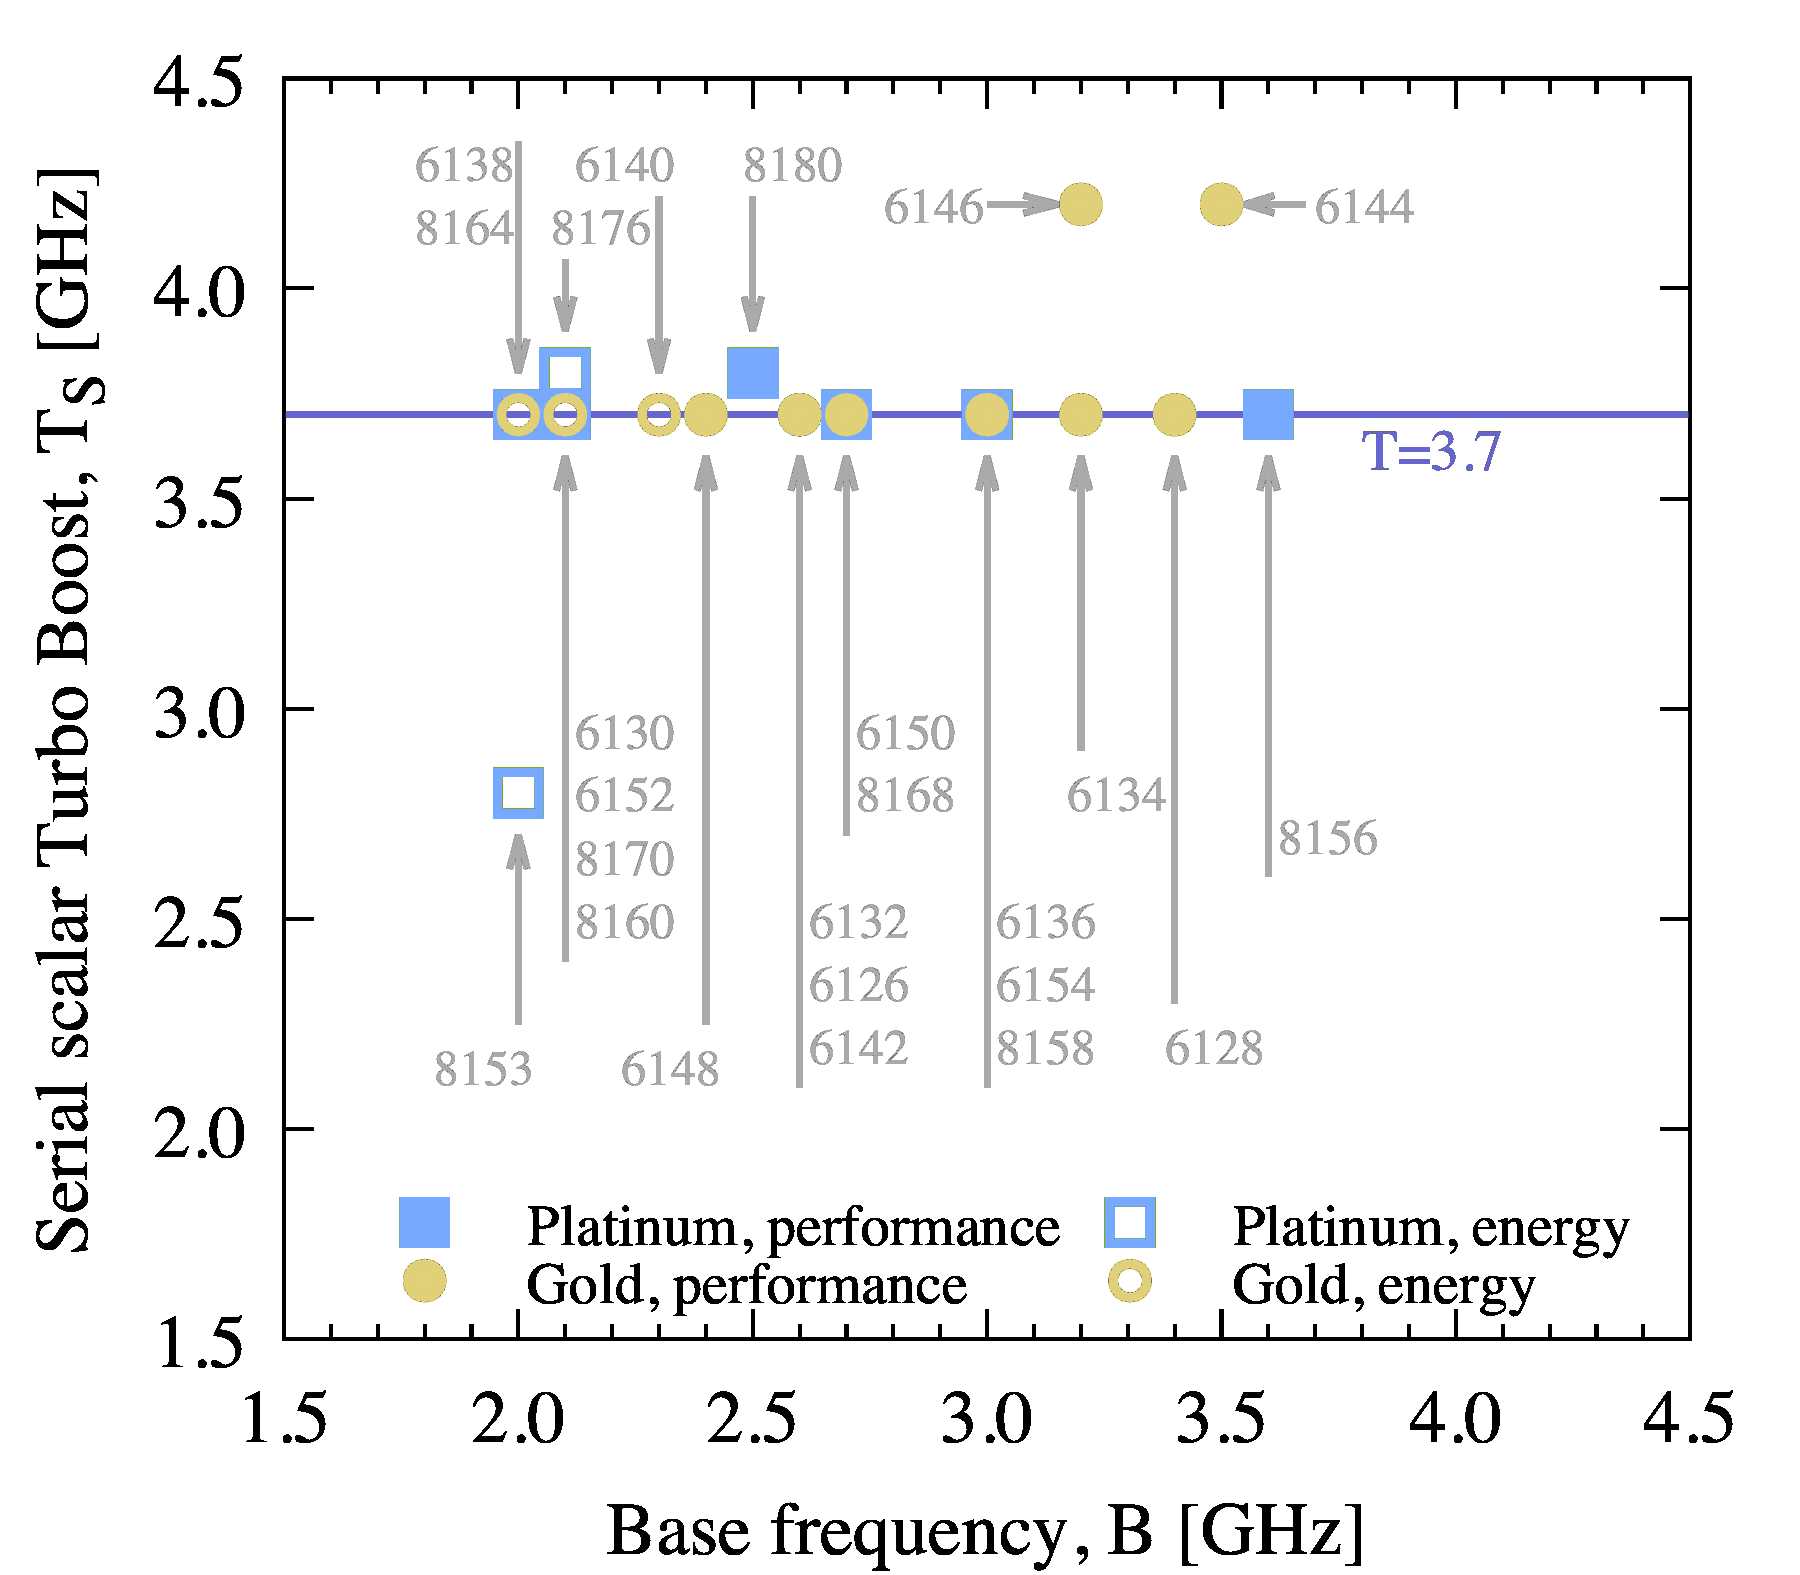
Figure 1: Maximum Turbo Boost frequency for serial workloads without vectorization.
The trend is apparent here: the maximum Turbo Boost frequency is nearly independent of the base frequency and is equal to 3.7 GHz for almost all models. Furthermore, there are two outliers, 6146 and 6144, which promise an additional 13.5% gain for 4.2 GHz, and 8153 with 2.8 GHz Turbo Boost (Section 3 explains its benefits). Because the clock frequency is often the only factor in the performance of serial applications, this trend states that any of the depicted CPUs will perform serial workloads, such as compilation, equally well.
The maximum Turbo Boost frequency is not guaranteed for all workloads. Additionally, the size of the Level 3 cache may play a role in some applications. So I have put this trend to the test on four processors: 6128, 6138, 6144 and 8160. The test is a serial compilation of the Linux kernel with heavily stripped features. During the test, I measured the clock frequency MS of the loaded core by querying /proc/cpuinfo. Results are shown in Table 3.
| Model | B | TS | MS | Δt, s |
| 6128 | 3.4 | 3.7 | 3.70 | 485 |
| 6138 | 2.0 | 3.7 | 3.64 | 490 |
| 6144 | 3.5 | 4.2 | 4.15 | 434 |
| 8160 | 2.1 | 3.7 | 3.70 | 487 |
Table 3: Performance test with serial compilation of the Linux kernel. MS is the measured clock frequency in GHz. Δt is the measured compilation time (lower is better).
These measurements confirm that the loaded cores closely approach the maximum Turbo Boost frequency of TS=3.7 GHz for 6128, 6138 and 8160, and 4.2 GHz for 6144. Furthermore, the compilation time Δt is the same for the three models with a TS=3.7 GHz and is 12% shorter for the processor with a TS=4.2 GHz. The base frequency, B, was not a good predictor of this single-threaded scalar workload.
In all tests, the system was a 2-socket \href{http://www.colfax-intl.com/nd/Servers/CX1260i-T-X7.aspx}{Colfax CX1260i-T-X7} rack mount server configured with twelve 16 GB DDR4 memory modules at 2666 MHz. It was running CentOS 7.3.
For this kernel compilation test, I bound the make tool to one of the cores using the tool numactl to simplify the measurement of the clock frequency. To eliminate the effects of file I/O, I staged the kernel source base in the RAM drive /dev/shm. As a consequence, getting the same performance with different CPUs cannot be blamed on I/O-limited performance. Therefore, it must be explained by the Turbo Boost technology.
2.2. Multi-Threaded, Scalar
To visualize the expected per-core performance of the Intel Xeon Scalable processors for multi-threaded scalar workloads, Figure 2 plots the corresponding maximum Turbo Boost frequency TPS versus the core count per socket.
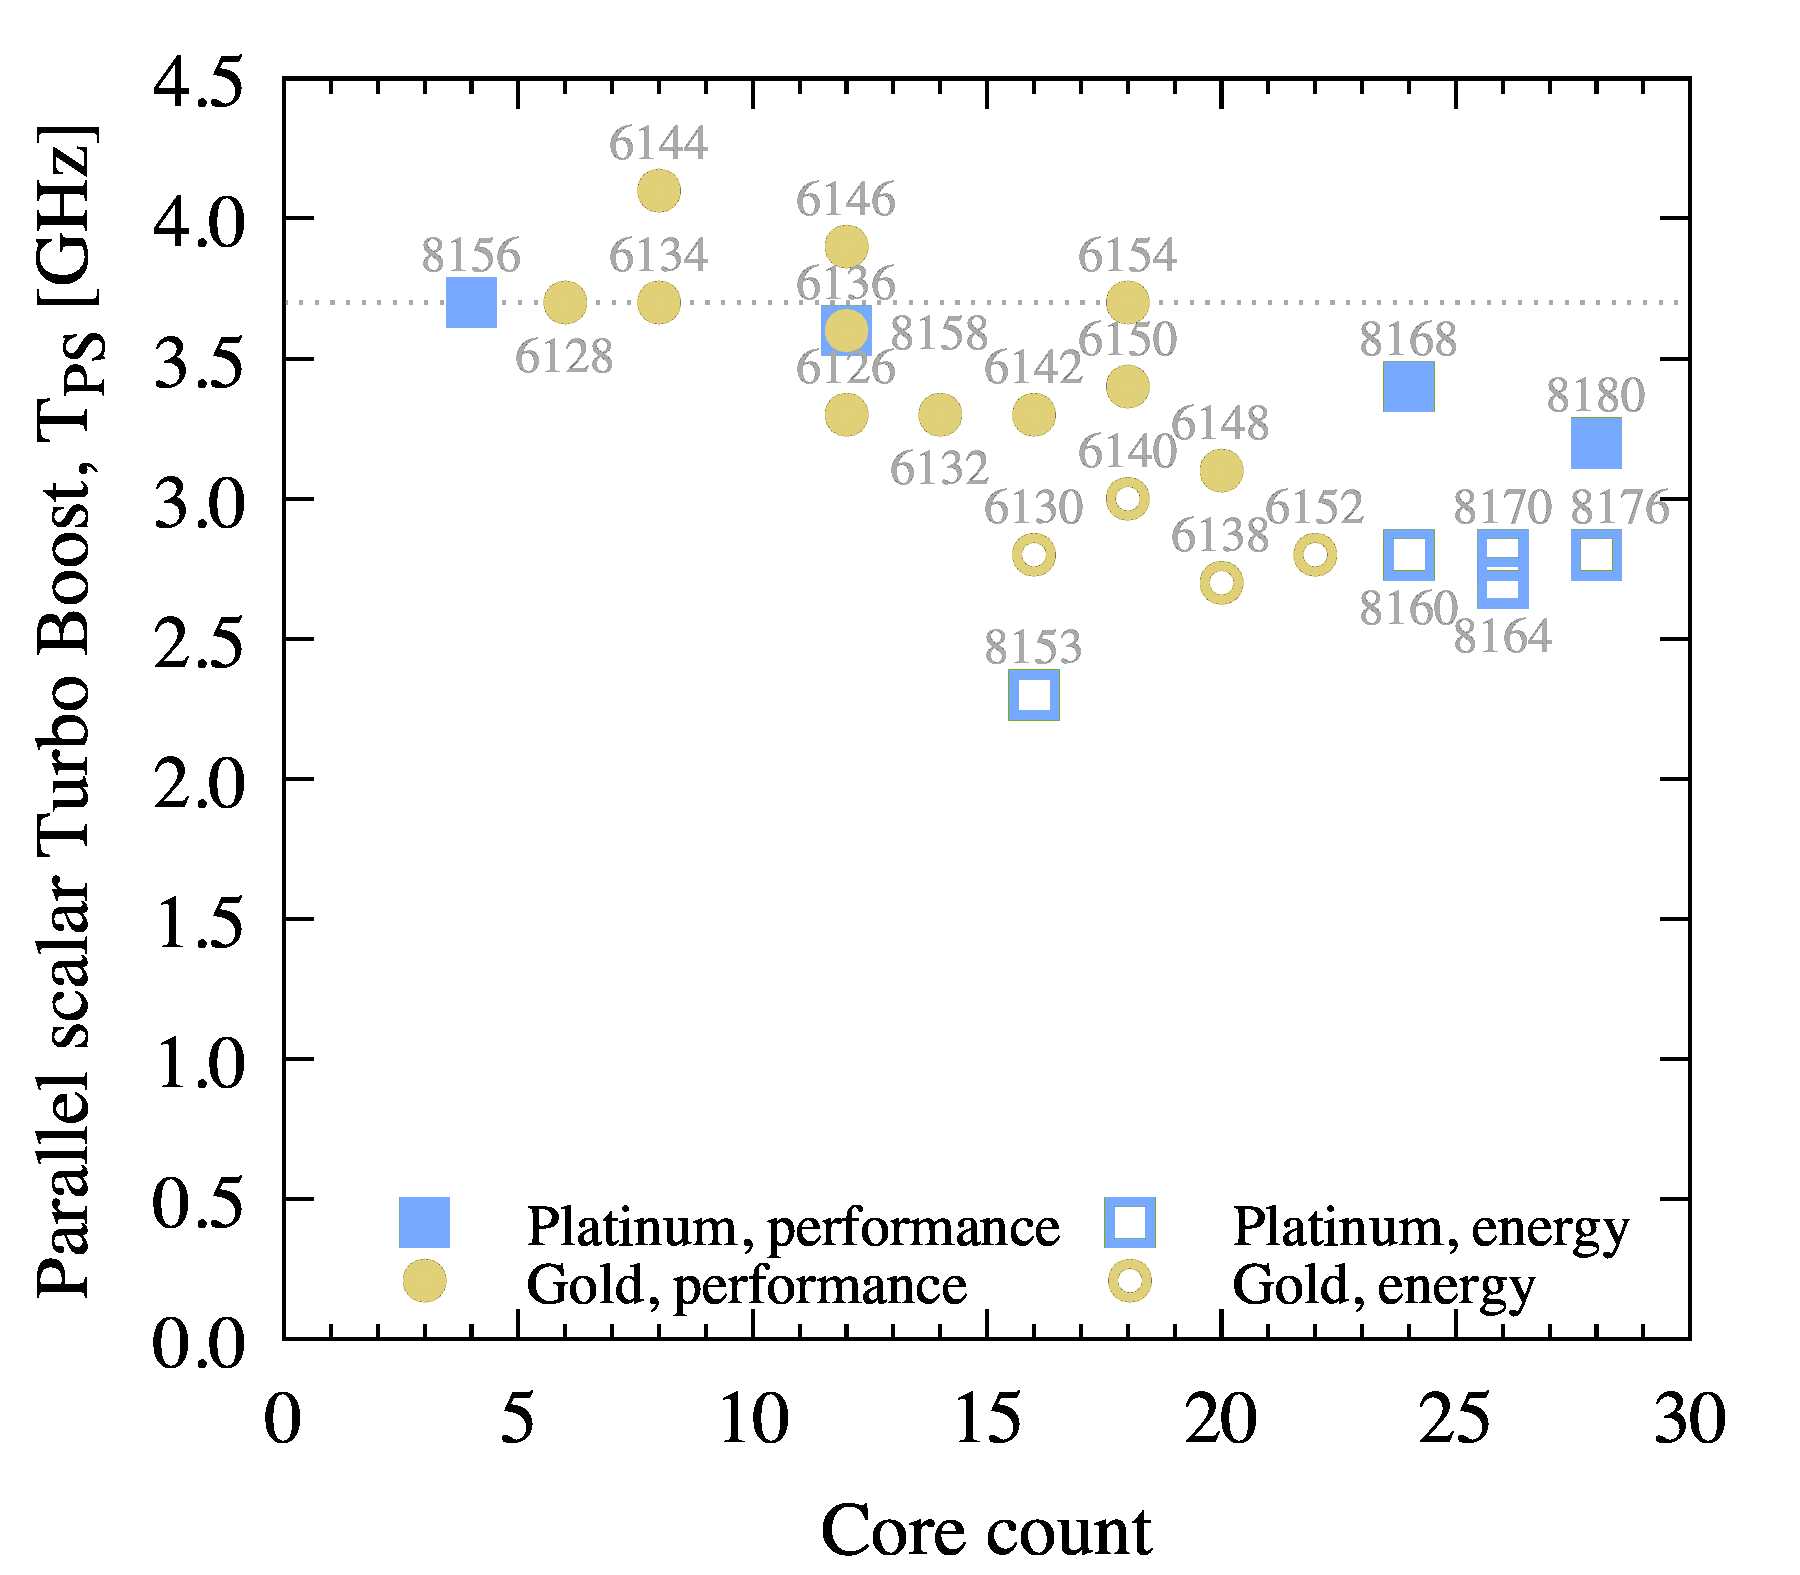
Figure 2: Maximum Turbo Boost frequency for scalar multi-threaded workloads utilizing all cores.
For most models, TPS is related to B as TPS=B+0.7 GHz. For one outlier model, 8153, this trend is broken with B=2.0 GHz and TPS=2.3 GHz.
If you are looking for the best performance {\it per core} within your budget in parallel workloads, you can use this the above figure as a guide, or translate the usually quoted B to TPS=B+0.7 GHz.
However, to estimate the performance of a CPU for a given parallel application, you need to take into account its parallel scalability. Not all compute-bound applications scale linearly with the number of threads. Insufficient parallelism, frequent synchronization between threads, false sharing, dependence on the memory traffic, or a large amount of non-parallelized code reduces the parallel efficiency. It would be too ambitious to try to give a recipe for estimating the performance in each situation. However, for the last case (serial code interleaved with linearly scaling parallel code), Amdahl’s law may be useful. If p is the fraction of the calculation that is parallelized, and N is the number of cores, then the estimated maximum speedup S=1/(1-p+p/N). This standard form of Amdahl’s law ignores Turbo Boost. It is easy to repeat the derivation incorporating the factor η to get the modified Amdahl’s law
 ,(1)
,(1)
where η=TPS/TS≤1. As a consequence, even for a fully parallelized calculation (p=1), the speedup S=ηN≤N. That is, N cores can give you the performance of 1 core multiplied by N and corrected for the clock speed reduction.
The dependence of S on p is particularly strong for large N. If p is not close enough to 1, the benefit of larger core count is low. If you can estimate p for your application, you can use Figure 3 as a guide to the projected performance.
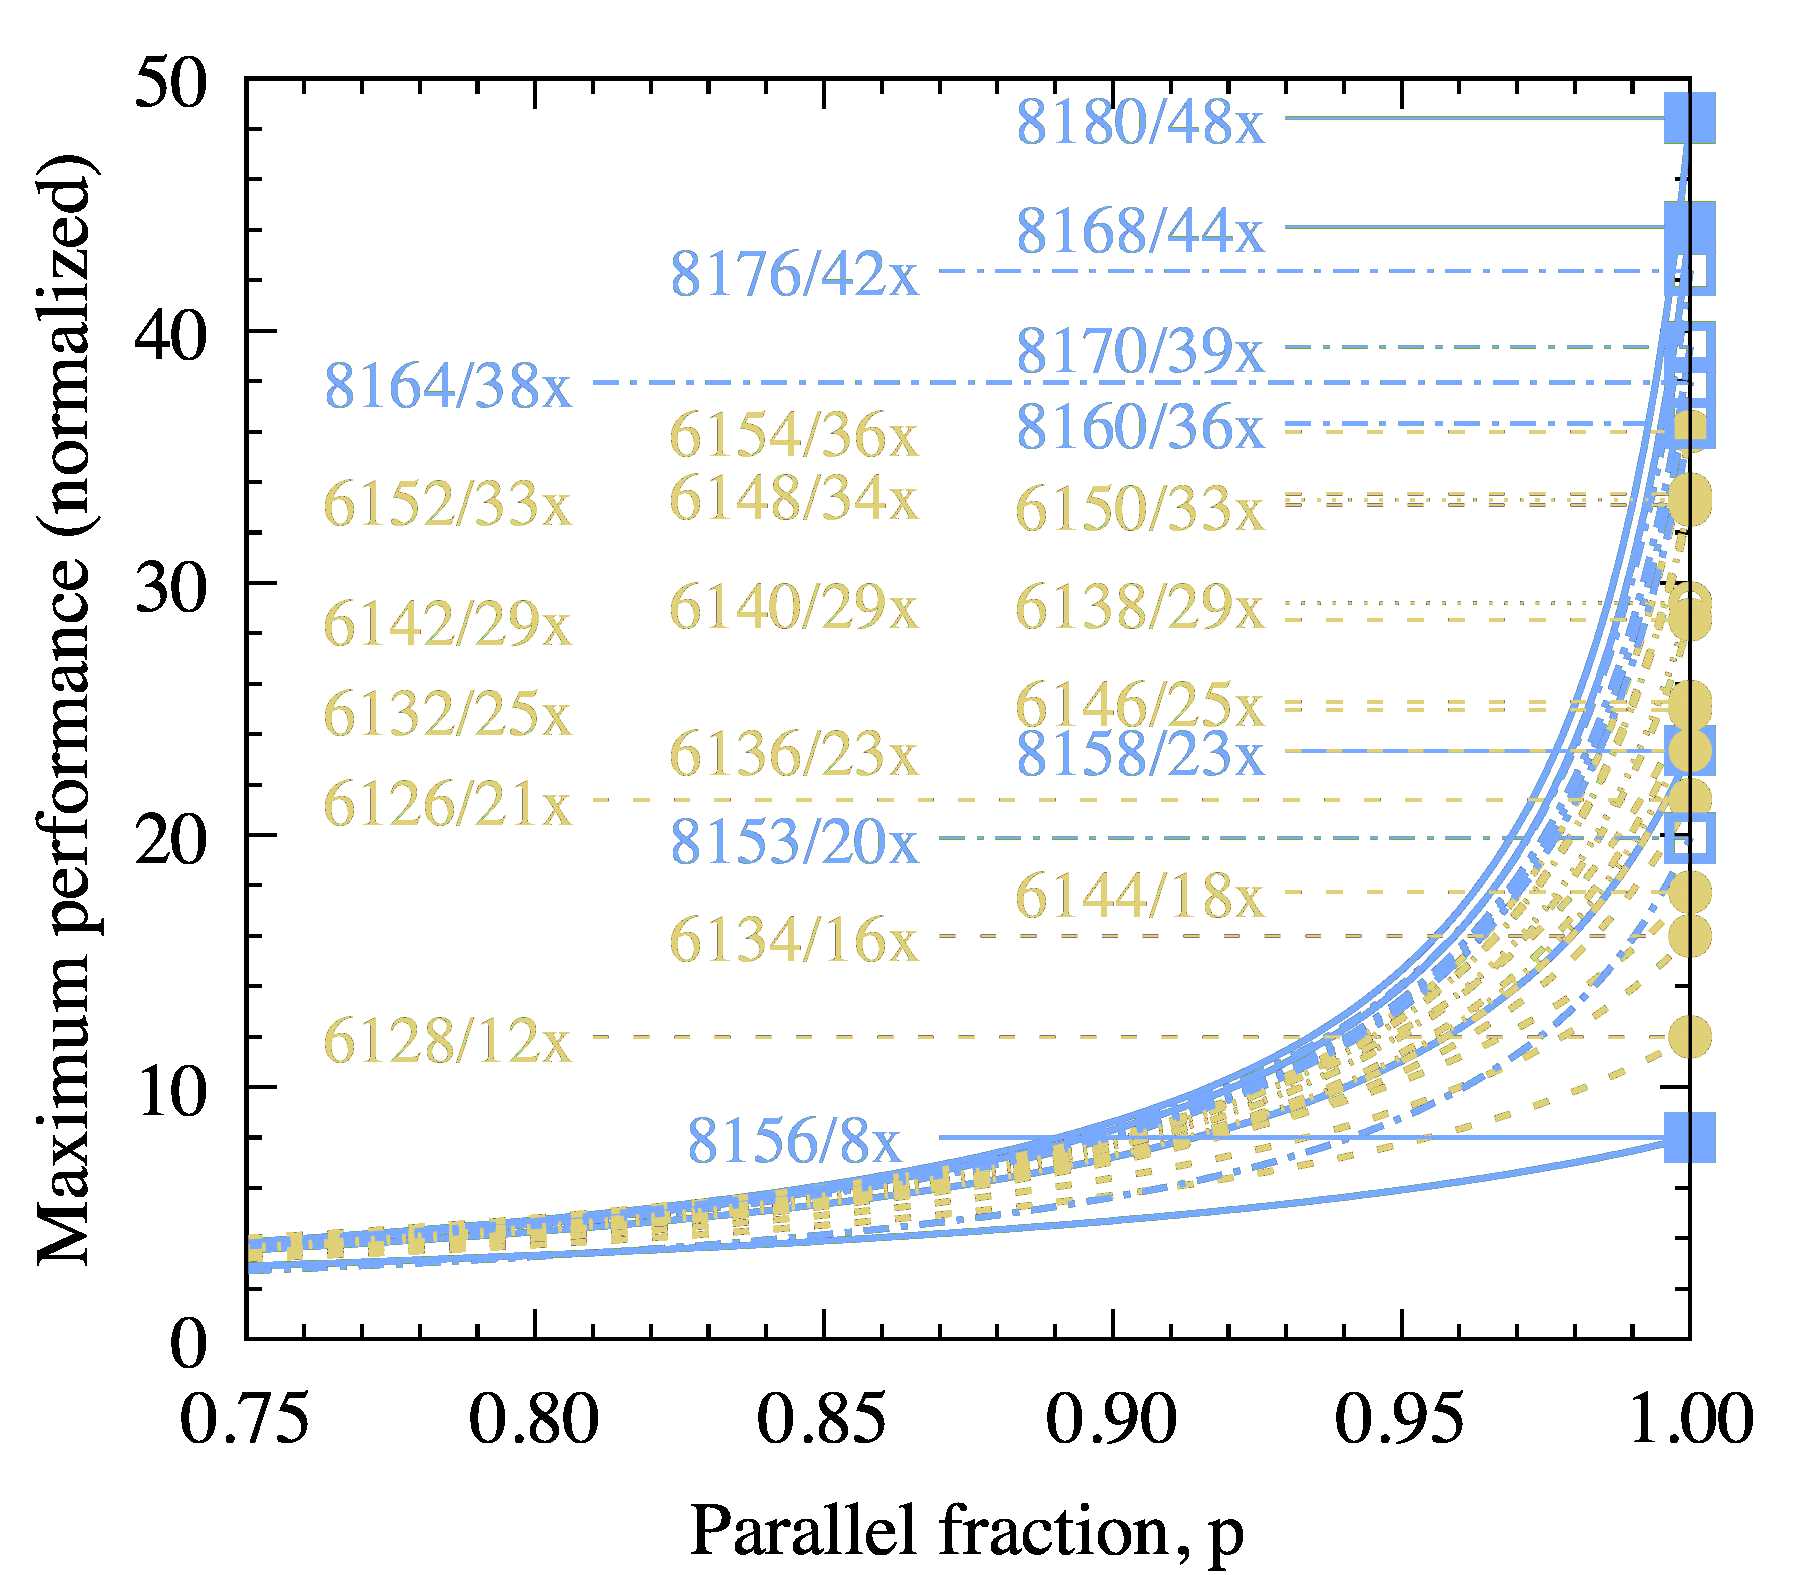
Figure 3: Modified Amdahl’s law for non-vectorized calculations with Turbo Boost. Performance values are relative to the single-threaded performance on a TS=3.7 GHz system. Values are for a 2-socket system with the named CPU (i.e., N=2C).
The Turbo Boost technology does not guarantee that TPS will be achieved for a parallel scalar code. To test it, I used the same four processors: 6128, 6138, 6144, and 8160 to run a multi-threaded, non-vectorized (i.e., scalar) calculation.
For the scalar parallel benchmark, I used a direct N-body calculation based on solution 4 of the N-body lab and converted to double precision. Even though the original code produces a vectorized executable, I removed the vectorization directives and compiled it with the Intel C++ compiler 18.0 using -no-vec to disable automatic vectorization. The resulting code uses XMM registers and arithmetic instructions ending with the suffix -sd, such as vmovsd, vmulsd, vfmadd231sd, which operate on one double precision number at a time. These instructions are representative of more complex calculations in which vectorization does not occur because the structure of the code or data containers does not allow it.
Table 4 shows the result: the average measured clock frequency of all cores under load MPS and the normalized performance PPS. The normalization constant for is chosen so that the performance of the same application on 6128 with 1 thread is equal to 1.
| Model | N | B | TPS | MPS | EPS | PPS |
| 6128 | 12 | 3.4 | 3.7 | 3.70 | 12 | 12 |
| 6138 | 40 | 2.0 | 2.7 | 2.48 | 29 | 25 |
| 6144 | 16 | 3.5 | 4.1 | 3.98 | 18 | 17 |
| 8160 | 48 | 2.1 | 2.8 | 2.62 | 36 | 34 |
Table 4: Performance test with multi-threaded scalar N-body calculation. N=2C is the core count in the 2-way system, MPS is the measured clock frequency in GHz. EPS is the expected normalized performance and PPS is the measured normalized performance.
You can compare these values to the maximum Turbo Boost performance TPS and the expected performance EPS from Figure 3. The measured clock frequencies are equal to or slightly (up to 8%) lower than the maximum Turbo frequency. The normalized performance is close to the predicted values, except for 6138, where it is 16% lower.
I have also performed a benchmark of parallel kernel compilation by calling the make tool with the argument -j 100. This test is different from the parallel N-body calculation in that there is very little floating-point math in the compilation process, and so it serves as an independent validation point.
The results are shown in Table 5.
| Model | N | B | TPS | MPS | EPS | PPS |
| 6128 &12 | 3.4 | 3.7 | 3.70 | 12 | 11 | |
| 6138 | 40 | 2.0 | 2.7 | 2.51 | 29 | 19 |
| 6144 | 16 | 3.5 | 4.1 | 4.10 | 18 | 15 |
| 8160 | 48 | 2.7 | 2.8 | 2.62 | 36 | 22 |
Table 5: Performance test with multi-processing in kernel compilation. Notation as in Table 4.
The clock frequencies in this benchmark are closer to the maximum Turbo Boost frequency than for the N-body test. That is probably because the fraction of the parallelized work, which we earlier denoted as p, is less than 1. At the same time, the gap between the normalized performance and expected performance is greater with the high-core count SKUs. For example, the 2-socket system with Intel Xeon Gold processor 6128 has a total of 12 cores, and the measured performance is 90% of the expectation. In contrast, the same 2-socket system with Intel Xeon Platinum processor 8160 has 48 cores and performs at just over 60% of the expectation.
2.3. Multi-Threaded, Vectorized
Figure 4 shows the maximum Turbo Boost frequency for multi-threaded workloads with heavy AVX-512 arithmetic.
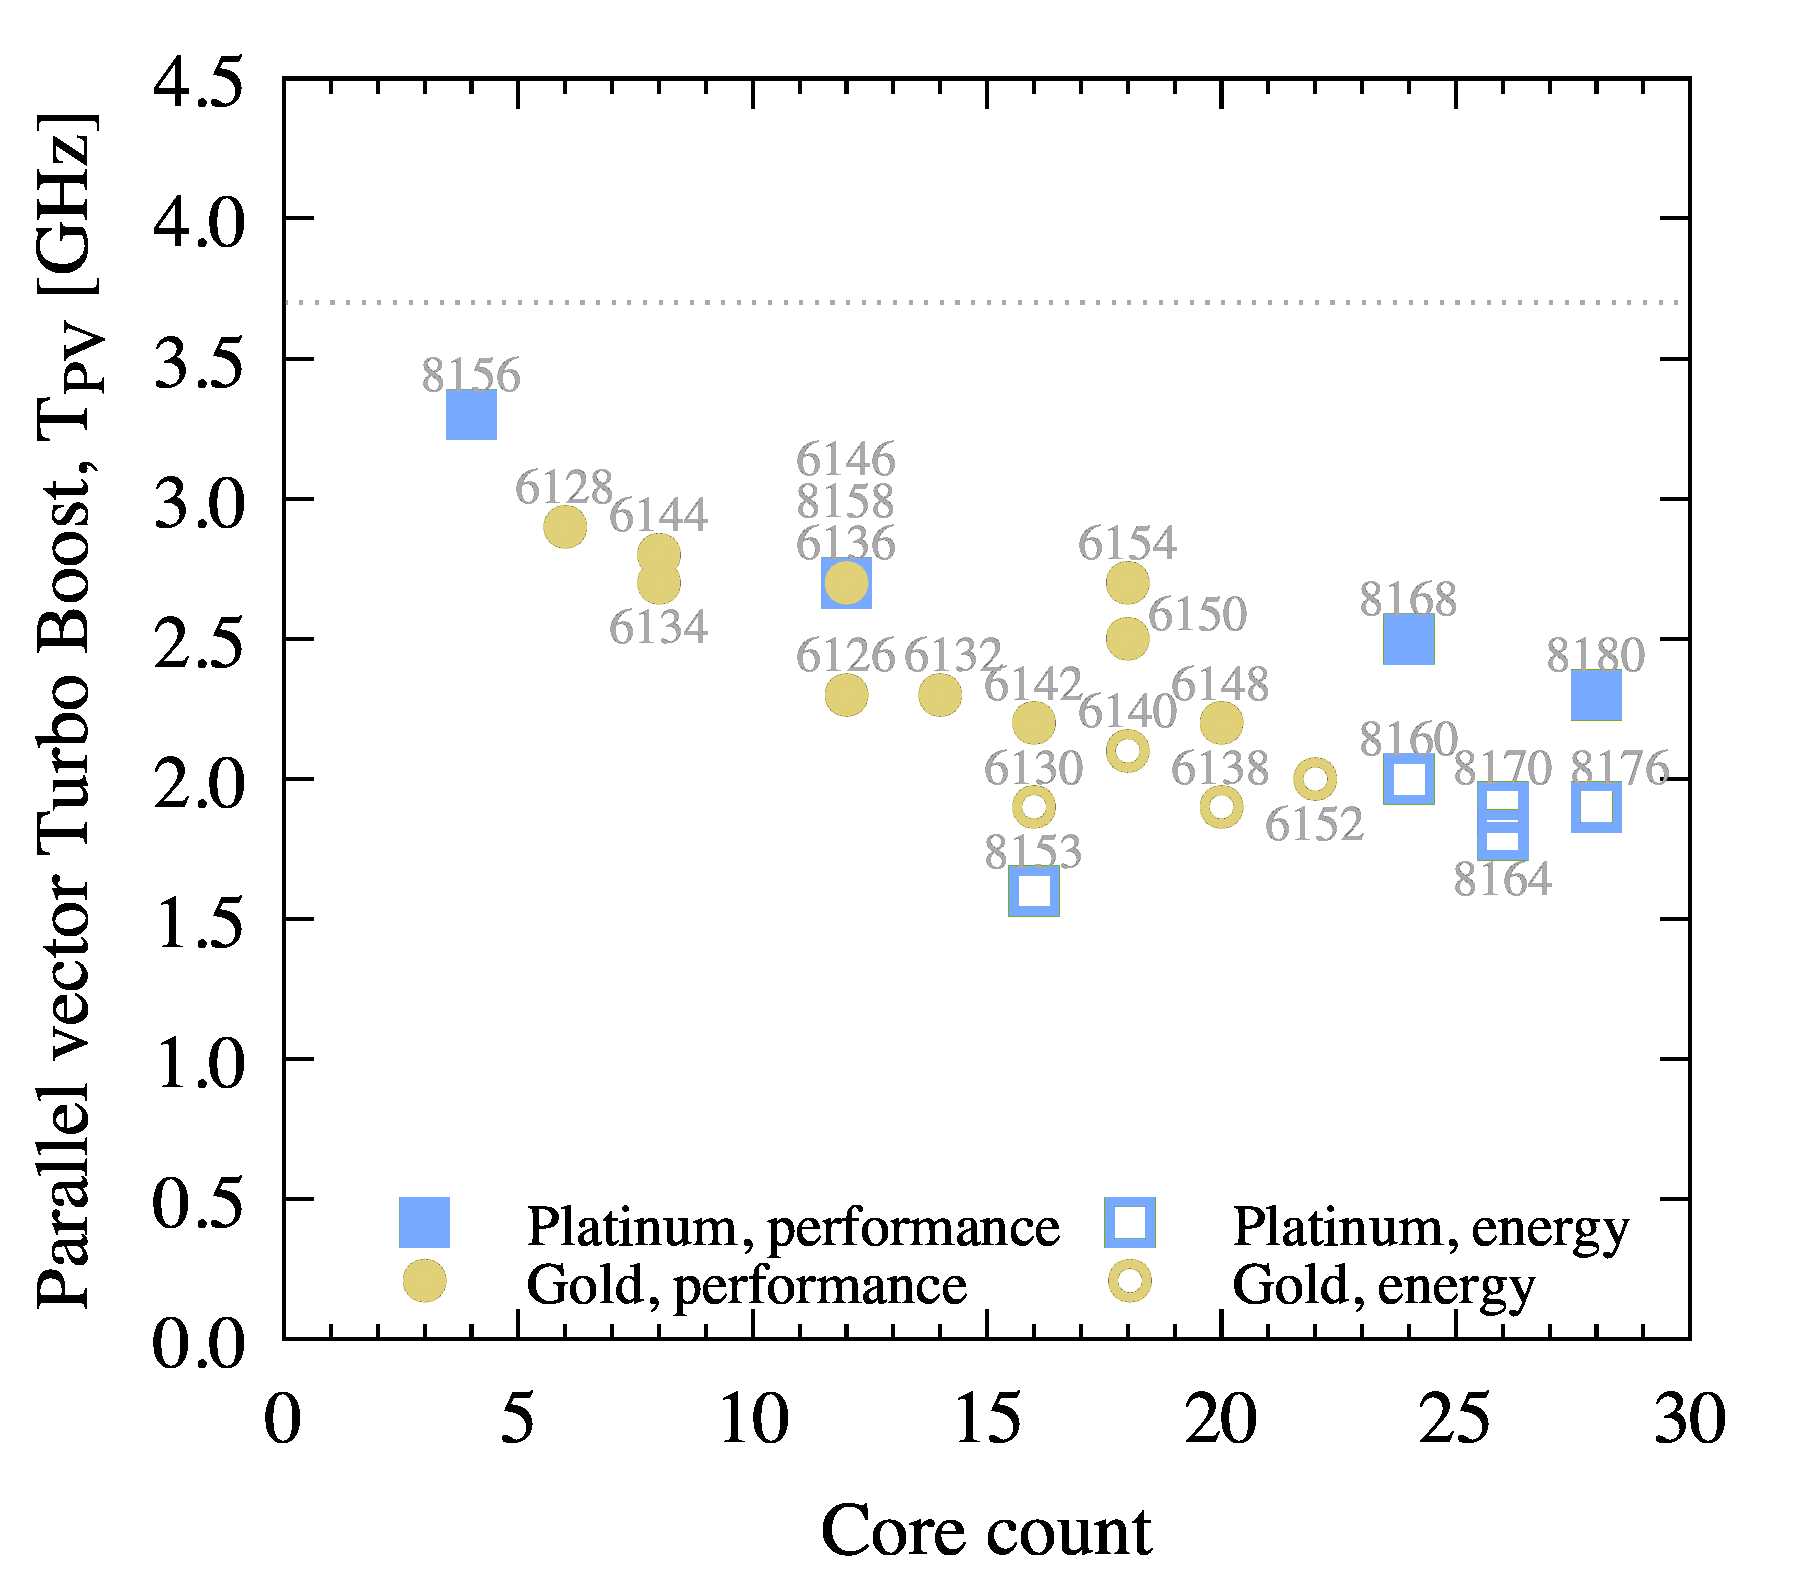
Figure 4: Maximum Turbo Boost frequency for multi-threaded workloads vectorized with AVX-512 and utilizing all cores.
For this type of workloads, the parallel efficiency S is also subject to the Amdahl’s law considerations. However, the speedup is not easy to estimate for this case because the definition of the fraction of parallelized work p is not well defined when the multi-threaded part of the calculation is vectorized, and the single-threaded part is not.
However, because compute-limited vectorized calculations perform mostly arithmetics and have little branching, we can define an absolute expectation of performance in units of FLOP/s (floating-point operations per second). Of course, it cannot be a single metric for all types of operations. For example, floating-point addition and multiplication in AVX-512 on the Skylake architecture have a throughput of 1 vector instruction per cycle in each FMA unit, while transcendental operations and division have much lower throughputs. On the other end of the spectrum, fused multiply-add (FMA) also has a throughput of 1 vector instruction per cycle per FMA unit, but you can count each FMA as two FLOPs on every vector lane. With this in mind, the FMA theoretical peak for Gold and Platinum processors is
 ,(2)
,(2)
where G is the expected performance in GFLOP/s, C is the number of cores per socket, TPV is the maximum Turbo Boost frequency for all cores loaded with AVX-512 instructions, L is the number of sockets, W is the vector width (W=16 for single precision, W=8 for double precision), H is the throughput of the instruction (H=1 instruction per cycle for addition, multiplication, subtraction and FMA), U is the number of FMA units (U=2 for Platinum 81xx and Gold 61xx processors, U=1 for all others), and F is the number of FLOPs per instruction (F=2 for FMA and F=1 for all other instructions).
Figure 5 plots G for the processors discussed in this paper.
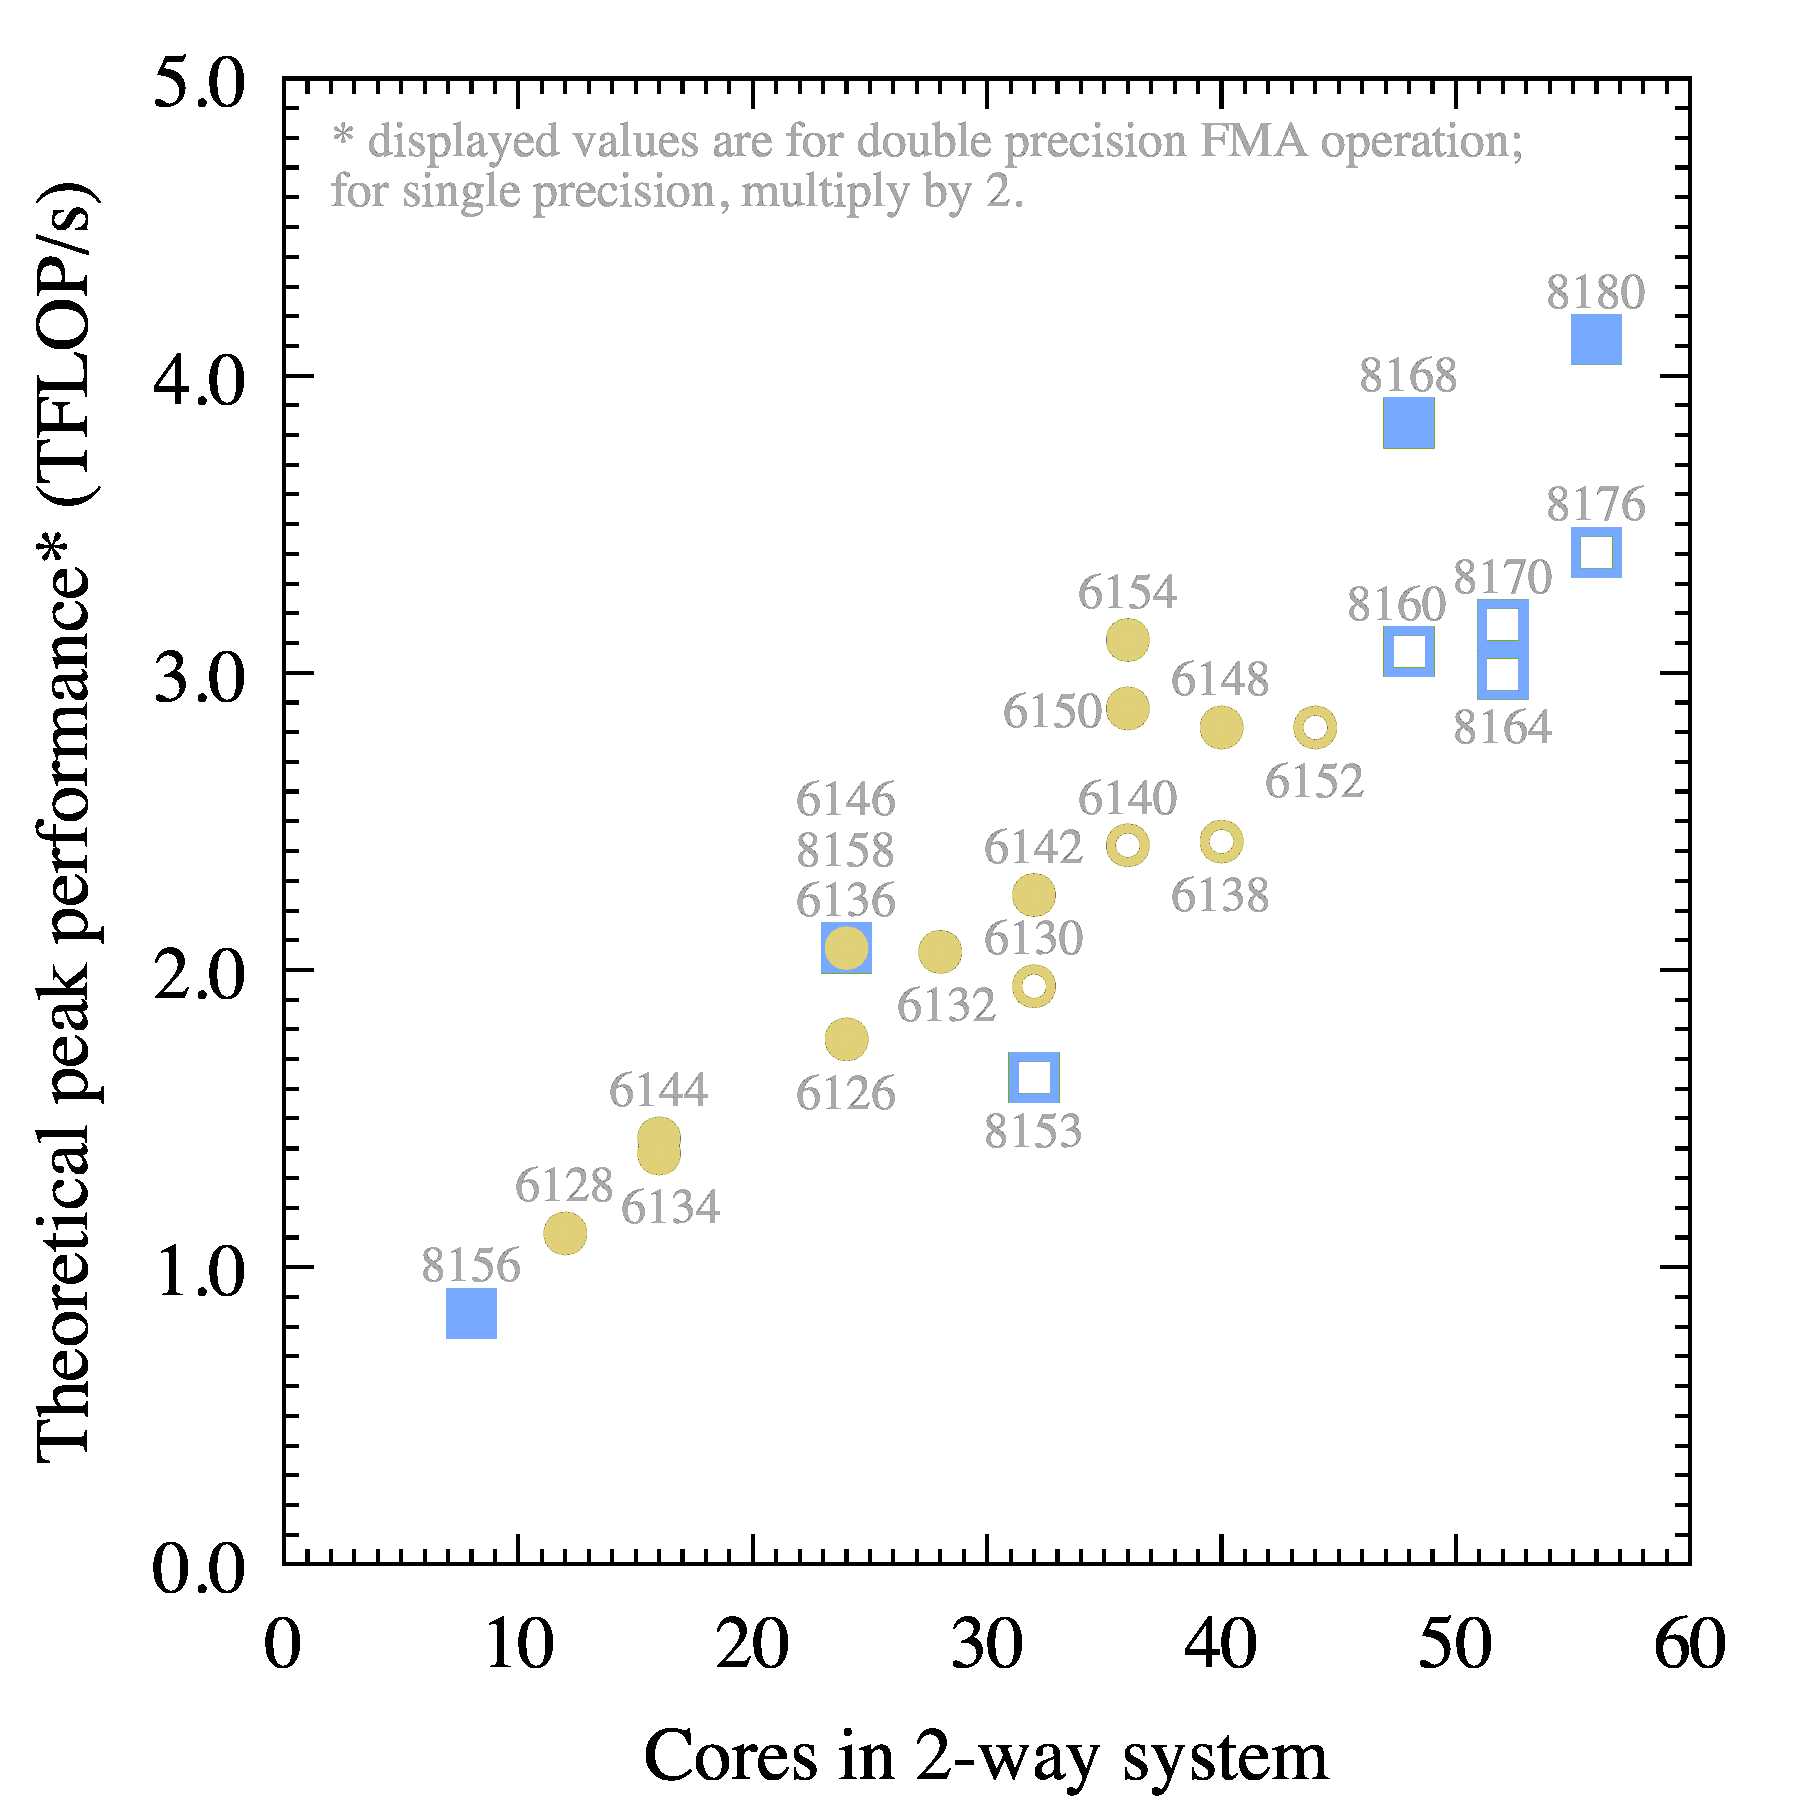
Figure 5: Theoretical peak performance of fused multiply-add in double precision on a 2-socket system.
The is value can be easily compared to the results of the HPL benchmark (which are also measured in FLOP/s) and to the performance of most linear algebra operations such as xGEMM (matrix-matrix multiplication). The latter directly translates into the expected performance in deep neural network training and inference.
To test the runtime clock frequency and the attained fraction of the theoretical peak, I ran benchmarked the four reference CPU models with a DGEMM (double precision matrix-matrix multiplication) calculation using the implementation in the Intel Math Kernel Library 2018 (MKL). xGEMM in MKL likes to use one thread per core, and hyper-threading was enabled on the system, so I had to set OMP_NUM_THREADS equal to the number of physical cores, OMP_PLACES=cores and OMP_PROC_BIND=close. To measure the clock speed under load, I made a snapshot of /proc/cpuinfo. Then I translated the DGEMM runtime into FLOP/s by dividing the number of floating-point operations 2n3 by the calculation time. Here n is the size of the multiplied matrices and n=24000 in these benchmarks. Table 6 shows the results.
| Model | N | B | TPV | MPV | G | RPV |
| 6128 | 12 | 3.4 | 2.9 | 2.90 | 1.11 | 1.02 |
| 6138 | 40 | 2.0 | 1.9 | 1.74 | 2.43 | 2.04 |
| 6144 | 16 | 3.5 | 2.8 | 2.80 | 1.43 | 1.29 |
| 8160 | 48 | 2.7 | 2.0 | 1.82 | 3.07 | 2.57 |
Table 6: Performance test with multi-threaded vectorized matrix-matrix multiplication. N=2C is the core count in the 2-way system, MPV is the measured clock frequency in GHz. G is the theoretical peak performance for FMA scalability and RPV is the measured performance.
To determine the clock frequency from the snapshot of /proc/cpuinfo, I retrieved and averaged the frequencies of the first hyper-thread on each core. The reported frequency of the other hyper-thread was different.
The result of this test is in agreement with the earlier tests in that the runtime clock frequency under load approaches the maximum Turbo Boost frequency. The measured performance RPV is 80 to 90% of the theoretical peak B. This is because matrix-matrix multiplication has a very complex memory access pattern designed to take advantage of caches and minimize access to the main memory. This cache traffic is non-negligible even for the matrix size n=24000. In contrast, we saw in this paper that for a purely arithmetic workload (e.g., chained FMA instructions), the frequency also matches the maximum Turbo Boost, and the performance is over 99% of the theoretical peak.
The second test for parallel vector calculations was the same N-body calculation that was described earlier, but this time compiled with vectorization directives and automatic vectorization by the Intel compiler. The assembly listing confirmed that the code uses AVX-512 instructions on ZMM registers. Therefore, we expect the runtime clock frequency to match TPV. Table 7 shows the results.
| Model | N | B | TPV | MPV | G | RPV |
| 6128 | 12 | 3.4 | 2.9 | 2.90 | 1.11 | 0.41 |
| 6138 | 40 | 2.0 | 1.9 | 1.90 | 2.43 | 0.89 |
| 6144 | 16 | 3.5 | 2.8 | 2.80 | 1.43 | 0.53 |
| 8160 | 48 | 2.7 | 2.5 | 2.00 | 3.07 | 1.12 |
Table 7: Performance test with multi-threaded vectorized N-body simulation. Notation as in Table 6.
For this test, the runtime clock frequency MPV is equal to TPV. However, the absolute value of performance, RPV, is around 37% of the peak. This illustrates that not floating point operations are equivalent. MPV is estimated for pure fused multiply-add. RPV is estimated based on a convention adopted in the N-body simulation field: each of the n2 particle-particle interactions requires 20 floating-point operations to compute. However, of these instructions only a few are FMAs; the others are additions and a reciprocal square root.
2.4. Bandwidth-Limited
Bandwidth-limited applications are those that access memory sequentially with multiple threads and do not perform enough arithmetics on each number read from or written to memory. In fact, “enough” can be quantified using the roofline model. For example, for the 8168 processor, a code performing fewer than 150 fused multiply-add operations on every floating-point number read from memory is likely to be bandwidth-limited. This threshold is lower for heavier operations: 75 for additions, subtractions and multiplications, and much lower for transcendental math and divisions. This threshold is also lower for low-end models with low core counts and clock speeds.
So I used the STREAM benchmark to measure the memory bandwidth on the reference systems. The result is shown in Figure 6.
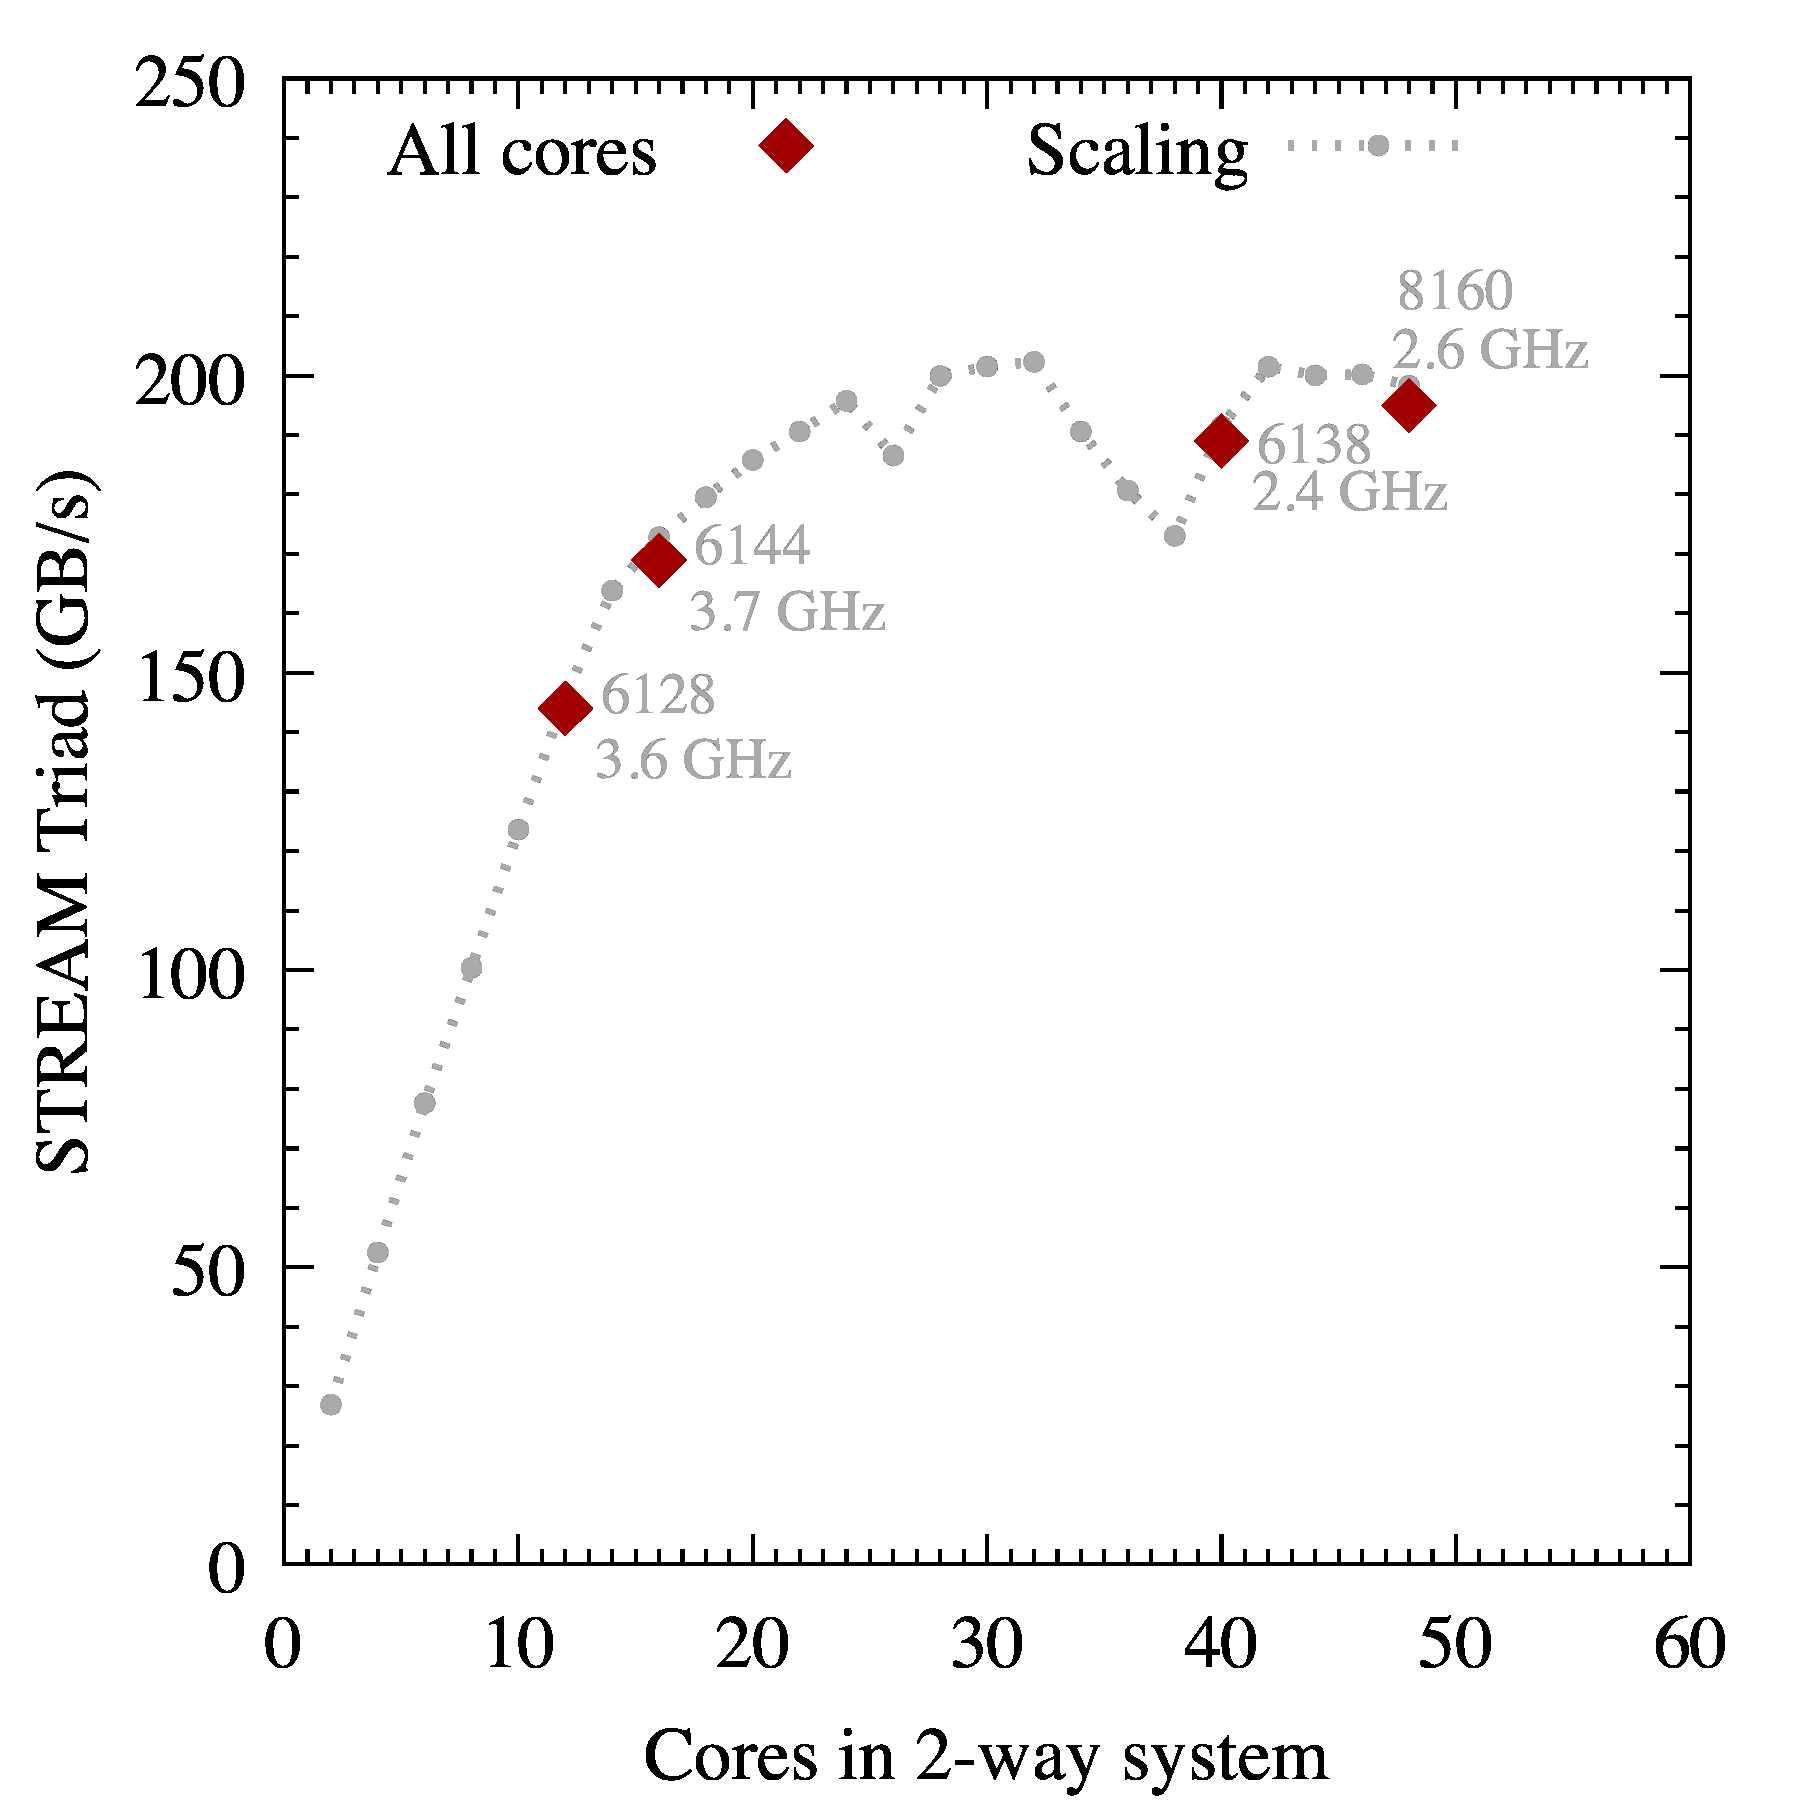
Figure 6: STREAM Triad test. The “All cores” data points are taken with 1 thread per physical core. The “Scaling” trend is on the 8168 processor.
I compiled the STREAM benchmark with the Intel C compiler 18.0. For the compilation, I set the preprocessor macro STREAM_ARRAY_SIZE=64000000 so that STREAM dataset is much larger than the combined L3 caches in the processors. I set NTIMES=500 to keep STREAM running for a long enough time to capture the runtime clock frequencies. At runtime, I set OMP_NUM_THREADS equal to the number of the physical cores, OMP_PLACES=threads and OMP_PROC_BIND=scatter for a bandwidth-friendly thread affinity. I recorded only the Triad test result.
You can see that the maximum performance is achieved in the processors with the greatest core counts. The clock frequency is not important.
This measurement indicates that in the Gold and Platinum groups of processors, the number of cores is the best indicator of the bandwidth-limited application performance. With 12 or more cores per socket (24 cores in 2-way system) running STREAM, the Triad test achieves close to the maximum performance of 200 GB/s. There are oddball thread counts per socket: 14, 18, 19 and 20 for which the performance is suppressed. However, for SKUs with the equivalent core counts, using fewer threads may maximize bandwidth. The lowest core count in the Gold 61xx family is 8, and the 8-core 6128 processor achieves 150 GB/s.
To validate these results, I ran the STREAM benchmark on the 8168 processor with values of OMP_NUM_THREADS from 2 to 48 with an increment of 2. The results are shown with grey points connected with a dotted line. This line passes through the measurements for 6128, 6144 and 6138. Based on this concordance, we can conclude that the maximum performance of bandwidth-bound applications does not depend on the CPU clock speed and is determined by the number of cores. However, the DDR4 clock frequency may also influence the bandwidth, so Gold 51xx, Silver and Bronze models may have a different dependence of bandwidth on core count.
3. Processor Choice Recommendations
For Serial Performance
The most unexpected result of this study may be that the base clock frequency listed in the most condensed technical specifications has no bearing on single-threaded application performance. This is because the Intel Turbo Boost 2.0 technology will clock up the clock frequency to TS=3.7 GHz in most Platinum and Gold 61xx processors. So, if you are an end user looking for a workstation processor or for a processor that will efficiently run single-threaded workloads, you can ignore the base clock frequency within the Platinum and Gold 61xx groups.
There are only two exceptions to this trend. Gold 6146 and Gold 6144 have a high Turbo Boost frequency TS=4.2 GHz. Platinum 8153 has a low frequency TS=2.8. The latter may be a good value for bandwidth-limited workloads.
For Scalar Parallel Performance
For non-vectorized code that nevertheless scales across all cores with multithreading or multiprocessing, the estimated maximum performance is CTPS. Here C is the core count and TPS is the Turbo Boost frequency for scalar code utilizing all cores. Figure 3 shows this product for Platinum and Gold 61xx models.
The most important aspect to keep in mind for this comparison is that if your application has less than 100% parallelism (p<1), the difference in performance between the models will be lower. For example, compare a Platinum 8158 processors (24 cores in a 2-socket configuration with TPS=3.6 GHz) to a Gold 6144 processor (16 cores in a 2-socket configuration with TPS=4.1 GHz). They have the same L3 cache size, so for p=1, the 8158 wins by a factor of 1.67. At p=0.85 (15% of the workload is serial), the 8158 loses to 6144 by a factor of 1.03.
If you are looking for a processor for highly-parallel scalar workloads, the top three models in terms of performance are 8180, 8168 and 8176. For workloads with low parallelism, for best value, look into the models in the top left corner of Figure 2, such as 8156, 6144, 6128 and 6134.
Improving parallelism in applications is the best way to leverage high-end models and maximize your return on infrastructure investment.
For Vector Parallel Performance
Vectorized multi-threaded calculations have a maximum Turbo Boost frequency listed in Table 2 in column TPV. The frequency/core count distribution is shown in Figure 4. Experiments in this paper show that this frequency is indeed achieved in compute-bound workloads such as DGEMM and the N-body calculation.
To judge the relative performance of the Platinum and Gold models, use Figure 5. Like in the scalar case, the top performers are 8180, 8168 and 8176. Naturally, this figure is for p=1, and for lower values of p, a scaling similar to that in Figure 3 applies. Therefore, for applications with sub-optimal scalability, models in the top left corner of Figure 4 may work well.
For Bandwidth-Limited Workloads
As we saw in the STREAM benchmark, the clock frequency and Turbo Boost have no bearing on bandwidth-limited workloads. Having 12 or more cores per socket is sufficient for delivering the maximum STREAM bandwidth around 200 GB/s for a 2-socket system. With fewer than 12 cores per socket, the bandwidth is lower.
The Platinum 8153 processor is an outlier with a low clock frequency. However, it has 16 cores per socket and supports up to 8 sockets. Considering its relatively low cost within the Platinum group, it may be an attractive option for bandwidth-limited calculations, especially in the 8-socket form-factor.
4. Silver and Bronze Models
I did not include Bronze, Silver or even Gold 51xx models in this paper because it would complicate the discussion due to the additional: number of FMA units, lower DDR4 clock speed, and the lack of Turbo Boost. However, for reference, Table 8 provides a global reference for the key technical specifications of all Intel Xeon Scalable processors.
| Model | C | B | TS | TPS | TPV | L3 | FMA | Turbo | Sockets | DDR4 | G* |
| 8180 | 28 | 2.5 | 3.8 | 3.2 | 2.3 | 38.5 | 2 | Yes | ≤ 8 | 2600 | 4122 |
| 8176 | 28 | 2.1 | 3.8 | 2.8 | 1.9 | 38.5 | 2 | Yes | ≤ 8 | 2600 | 3405 |
| 8170 | 26 | 2.1 | 3.7 | 2.8 | 1.9 | 35.75 | 2 | Yes | ≤ 8 | 2600 | 3162 |
| 8168 | 24 | 2.7 | 3.7 | 3.4 | 2.5 | 33 | 2 | Yes | ≤ 8 | 2600 | 3840 |
| 8164 | 26 | 2.0 | 3.7 | 2.7 | 1.8 | 35.75 | 2 | Yes | ≤ 8 | 2600 | 2995 |
| 8160 | 24 | 2.1 | 3.7 | 2.8 | 2.0 | 33 | 2 | Yes | ≤ 8 | 2600 | 3072 |
| 8158 | 12 | 3.0 | 3.7 | 3.6 | 2.7 | 24.75 | 2 | Yes | ≤ 8 | 2600 | 2074 |
| 8156 | 4 | 3.6 | 3.7 | 3.7 | 3.3 | 16.5 | 2 | Yes | ≤ 8 | 2600 | 845 |
| 8153 | 16 | 2.0 | 2.8 | 2.3 | 1.6 | 22 | 2 | Yes | ≤ 8 | 2600 | 1638 |
| 6154 | 18 | 3.0 | 3.7 | 3.7 | 2.7 | 24.75 | 2 | Yes | ≤ 4 | 2600 | 3110 |
| 6152 | 22 | 2.1 | 3.7 | 2.8 | 2.0 | 30.25 | 2 | Yes | ≤ 4 | 2600 | 2816 |
| 6150 | 18 | 2.7 | 3.7 | 3.4 | 2.5 | 24.75 | 2 | Yes | ≤ 4 | 2600 | 2880 |
| 6148 | 20 | 2.4 | 3.7 | 3.1 | 2.2 | 27.5 | 2 | Yes | ≤ 4 | 2600 | 2816 |
| 6146 | 12 | 3.2 | 4.2 | 3.9 | 2.7 | 24.75 | 2 | Yes | ≤ 4 | 2600 | 2074 |
| 6144 | 8 | 3.5 | 4.2 | 4.1 | 2.8 | 24.75 | 2 | Yes | ≤ 4 | 2600 | 1434 |
| 6142 | 16 | 2.6 | 3.7 | 3.3 | 2.2 | 22 | 2 | Yes | ≤ 4 | 2600 | 2253 |
| 6140 | 18 | 2.3 | 3.7 | 3.0 | 2.1 | 24.75 | 2 | Yes | ≤ 4 | 2600 | 2419 |
| 6138 | 20 | 2.0 | 3.7 | 2.7 | 1.9 | 27.5 | 2 | Yes | ≤ 4 | 2600 | 2432 |
| 6136 | 12 | 3.0 | 3.7 | 3.6 | 2.7 | 24.75 | 2 | Yes | ≤ 4 | 2600 | 2074 |
| 6134 | 8 | 3.2 | 3.7 | 3.7 | 2.7 | 24.75 | 2 | Yes | ≤ 4 | 2600 | 1382 |
| 6132 | 14 | 2.6 | 3.7 | 3.3 | 2.3 | 19.25 | 2 | Yes | ≤ 4 | 2600 | 2061 |
| 6130 | 16 | 2.1 | 3.7 | 2.8 | 1.9 | 22 | 2 | Yes | ≤ 4 | 2600 | 1946 |
| 6128 | 6 | 3.4 | 3.7 | 3.7 | 2.9 | 19.25 | 2 | Yes | ≤ 4 | 2600 | 1114 |
| 6126 | 12 | 2.6 | 3.7 | 3.3 | 2.3 | 19.25 | 2 | Yes | ≤ 4 | 2600 | 1766 |
| 5122 | 4 | 3.6 | 3.7 | 3.7 | 3.3 | 16.5 | 2 | Yes | ≤ 4 | 2600 | 845 |
| 5120 | 14 | 2.2 | 3.2 | 2.6 | 1.6 | 19.25 | 1 | Yes | ≤ 4 | 2400 | 716 |
| 5118 | 12 | 2.3 | 3.2 | 2.7 | 1.6 | 16.5 | 1 | Yes | ≤ 4 | 2400 | 614 |
| 5115 | 10 | 2.4 | 3.2 | 2.8 | 1.6 | 13.75 | 1 | Yes | ≤ 4 | 2400 | 512 |
| 4116 | 12 | 2.1 | 3.0 | 2.4 | 1.4 | 16.5 | 1 | Yes | ≤ 2 | 2400 | 538 |
| 4114 | 10 | 2.2 | 3.0 | 2.5 | 1.4 | 13.75 | 1 | Yes | ≤ 2 | 2400 | 448 |
| 4112 | 4 | 2.6 | 3.0 | 2.9 | 1.4 | 8.25 | 1 | Yes | ≤ 2 | 2400 | 179 |
| 4110 | 8 | 2.1 | 3.0 | 2.4 | 1.3 | 11 | 1 | Yes | ≤ 2 | 2400 | 333 |
| 4108 | 8 | 1.8 | 3.0 | 2.1 | 1.2 | 11 | 1 | Yes | ≤ 2 | 2400 | 307 |
| 3106 | 8 | 1.7 | 1.7 | 1.7 | 0.8 | 11 | 1 | No | ≤ 2 | 2133 | 205 |
| 3104 | 6 | 1.7 | 1.7 | 1.7 | 0.8 | 8.25 | 1 | No | ≤ 2 | 2133 | 128 |
Table 8: Summary of technical specifications of Intel Xeon Scalable processors. G is computed according to Equation (2).
For Gold 51xx, Silver and Bronze processors, the supported DDR4 frequency is lower, and so is the core count, which may result in a suppression of bandwidth-limited application performance compared to the Gold 61xx and Platinum groups.
5. Large Memory, Integrated Fabric, Thermal Optimization
The following Intel Xeon Scalable models with the suffix -M support up to 1.5 TB of RAM per socket: 8180M, 8176M, 8170M, 8160M, 6142M and 6140M. Aside from the maximum amount of RAM, they have the same technical specifications as the corresponding models without the -M suffix: 8180, 8176, 8170, 8160, 6142 and 6140, respectively.
Models with the suffix -F feature integrated Intel Omni-Path fabric: 8176F, 8160F, 6148F, 6142F, 6138F, 6130F and 6126F. Their technical specifications are the same as in the corresponding models without the -F suffix, however, the Platinum models with fabric support up to 4 sockets and Gold models with fabric support up to 2 sockets.
The suffix -T indicates thermal optimizations for a 10-year lifespan. In technical specifications, this is reflected by a lower (than in the corresponding model without -T) maximum temperature allowed at the processor’s Integrated Heat Spreader (IHS). Theoretically, this may mean, in some circumstances, a smaller increase in the clock frequency due to the Turbo Boost technology. However, we have not tried to verify this assumption. Thermally optimized models are 8160T, 6138T, 6130T, 6126T, 5120T, 5119T, 4116T, 4114T and 4109T.