Canonical Stratification for Non-Mathematicians

Our recent publication “Algorithmic Canonical Stratifications of Simplicial Complexes” proposes a new algorithm for data analysis that offers a topology-aware path towards explainable artificial intelligence. Despite (or, perhaps, due to) being mathematically rigorous, the text of the original work is virtually impenetrable for readers not familiar with the concepts, tools, and notation of topology. In order to convey our ideas to a wider audience, we present this supplemental introduction. Here, we summarize and explain in plain English the motivation, reasoning, and methods of our new topological data analysis algorithm that we term “canonical stratification”.
Table of Contents
1. Motivation
Machine learning has advanced significantly in recent years and has proven itself to be a powerful and versatile tool in a variety of data-driven disciplines. Machine learning algorithms are now being used to make decisions in numerous areas such as bank fraud detection, autonomous vehicles, and medical diagnosis. However, the increasing adoption of AI as a decision maker raises challenging questions about our ability to trust and justify the decisions that an AI reaches.
For many machine learning algorithms, it is often difficult to determine why a certain decision was made by the algorithm. This “black-box” approach to machine learning often leads to situations where AI makes a correct decision for the wrong reasons. For example, in a case study conducted by researchers in Berlin, an AI algorithm tasked with learning to recognize an image of a horse instead learned to recognize the copyright notice that was present in the majority of pictures with horses in them. For applications that require a high degree of trust, such as those in medical or military fields, this lack of transparency and potential for an AI to “cheat” are unacceptable. To address this issue, there have been increasing efforts to develop so-called Explainable AI (XAI) algorithms: machine learning algorithms that can justify their decisions to human users.
One promising XAI research area, called Topological Data Analysis (TDA), approaches the problem of inference on data with a concept that is natural to us: shapes. Characterizing an object by its shape is one of the primary methods that we can use to describe an object. Similarly, TDA seeks to characterize data through its “shape” using tools from the mathematical field of topology. To be more precise, the “shapes” as typically understood in TDA, which are called manifolds, are a natural generalization of what we call shapes in everyday life. Although these generalized shapes may be more difficult for us to grasp, working with them allows us describe and characterize a wide variety of datasets; for example, this includes not only image data (as might be expected), but also datasets that can be encoded as graphs, which often arise when analyzing social networks. From the standpoint of XAI, describing data through its shape is highly desirable, because explanations like “decision A was made because the data had shape B” are more intelligible to people than “decision A was made because the data was similar to vector B”.
On top of describing data by shapes, our work aims to add another XAI tool to the TDA toolkit: dividing data by shapes. Currently, almost all TDA toolkits focus on describing a single, global shape of a given dataset. However, some large datasets might be better described as a collection of smaller, localized shapes. The stratification algorithm presented in our paper divides a given dataset into groups where each group is a part of some shape. This can be used on its own as a clustering workload to find groups in a dataset (e.g., friend groups in a social network), and can also be used in conjunction with other TDA methods to describe data as a combination of multiple shapes. We hypothesize that our stratification algorithm will facilitate the capabilities of TDA methods to be effectively applied to a wider range of real-world problems.
2. More on Canonical Stratification
In this section, we present an overview and some intuition for our canonical stratification (CaSt) algorithm for readers with a data science background. We first briefly give a general overview of TDA and discuss the advantages of working with topological spaces. We then discuss some limitations of current TDA methods, and how our CaSt algorithm aims to remedy them. >/p>
Shapes of Data
Comprehending the geometric shape of one’s data can be very useful in the analysis of that data. Take, as a simple example, the vertices and edges plotted in 2D Euclidean space in Figure 1.
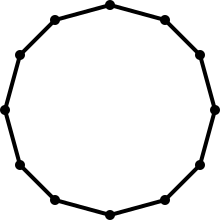
Figure 1
The vertices and the edges form a circle, and this information can help us make educated guesses about the data. For example, we can reasonably infer that the collection of data points samples a circular object, such as a wheel. Furthermore, if a new data point that lies on the circle is added, we can be fairly confident that this new data point is part of the same group. Although this is a highly simplified example, it serves to illustrate how shape comprehension can be a useful tool in extracting information from more complicated datasets. The key idea is that the notion of shape can provide a more concise and descriptive summary of one’s data than its “raw” representation as a collection of data points.
However, an analytics methodology that only involves visualizable shapes like a circle has several deficiencies that serve to limit the possible datasets that it can work with. One problem is that our traditional conception of shape is limited to 3 dimensions: because we cannot visualize 4 dimensional or higher shapes, a statement like the data is a “triangle in 5 dimensions” does not have an obvious meaning without involving more sophisticated mathematics. In data analytics, it is common to have datasets that have dozens of fields, with each field corresponding to one dimension. To make inferences regarding these high-dimensional datasets, we need to expand our notion of shape.
Another problem is that these shapes may undergo unwanted distortions upon scalings, rotations, or perturbations of the underlying dataset that should not change the inferences one would make about the data. For example, let’s plot the dataset from Figure 1 in a space {x',y'} given by:
 (1)
(1)
 (2)
(2)
In other words, the y-axis has been scaled by a factor of one-fifths. The same dataset as Figure 1 plotted in this space “appears” to be an ellipse.
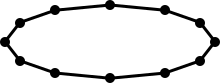
Figure 2
Scaling such as above can occur by just changing units along one axis, so traditional shapes are unfit for datasets with heterogeneous features. Furthermore, this was a simple case where the coordinates were stretched in one dimension by a constant, but in other cases the deformation need not be by a constant factor. Because it is possible to stretch or contract a space so that the dataset “appears” to be another shape, like transforming a circle into an ellipse, a dataset having some traditional shape in one representation may have a different shape in another representation.
TDA addresses these problems through tools derived from the mathematical field of topology. Topology supplies a rigorous definition of shape that can have an arbitrary number of dimensions. In addition, these shapes are invariant under continuous deformations (like stretching or contracting). Thus, in terms of topology, Figure 1 and Figure 2 are the same shape (a 1-sphere).
Furthermore, the datasets and the “shapes” do not even have to be geometric in origin. For example, it is possible to speak about the shape of a graph that does not have intrinsic coordinates, like a social network graph. These properties allow TDA to be applied on a much wider range of datasets than a cruder analysis only using traditional shapes.
Subdividing Data
The primary mathematical tool used in TDA is homology, which can be used to extract the global “shape” of one’s data in the sense of topology. Mathematically, homology is a linear-algebraic invariant of a topological space that provides refined and computable information about the space; for example, for spaces that have a well-defined dimension (like manifolds), homology detects the dimension of a space. Intuitively, homology detects the presence of “holes” in a shape via a succession of “homology groups”; the first homology groups measures the number of circles in the shape that cannot be filled in, the second homology group measures the number of spheres in the shape that cannot be filled in, and so forth. However, although the information obtained via computation of the homology groups is useful for obtaining a “big picture” of the data, it doesn’t always provide detailed information about the various components of the dataset. For example, consider the dataset shown in figure 3:
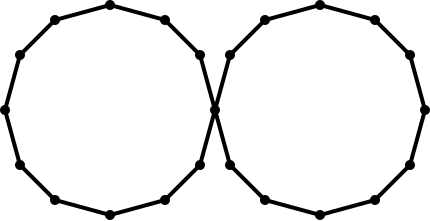
Figure 3
An analysis of the homology groups will determine the global shape of this dataset to be two “circles” intersecting at a vertex. Subsequently, a potential next step for analyzing a dataset like this might be to split the dataset and independently analyze each of the two circles. However, by itself knowledge of the homology groups does not provide information on how to split this data. Although homology recognizes the global structure of the two circles, it does not provide information on which circle each vertex (and edge) belong to.
For this particular example, it is possible to do a secondary pass to separate out the circles. However, in practice doing a secondary analysis like this on an arbitrary dataset typically requires either a priori knowledge of what the shapes look like, or otherwise manual intervention. This is not scalable for large, high-dimensional datasets that contain shapes of various dimensions and types. We note that the problem can be somewhat mitigated by first subdividing the data into small subsets or regions and then performing each analysis independently. Nonetheless, this process often involves an arbitrary selection of how to do the division, and may also lose relevant global information.
We conclude that a systematic process for subdividing data based on topological information will be useful, either in augmenting existing global TDA toolkits, or even on its own. This is one of the primary motivations behind the CaSt algorithm presented in our publication. The CaSt algorithm provides a procedure for subdividing the dataset into groups that topologically appear to be part of the same shape; we call the resulting division the canonical stratification of the data. More specifically, the algorithm takes every object known as a simplex in the dataset (vertices, edges, faces, tetrahedra and their higher-dimensional equivalents) and assigns them to a grouping called a stratum. The algorithm applied to the dataset in Figure 3 will divide the dataset into 3 strata shown in red, green and blue in Figure 4.
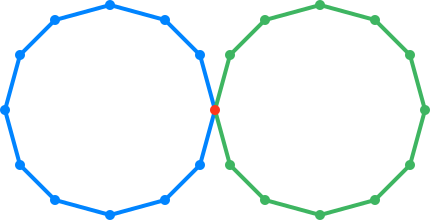
Figure 4
Here, the two circles, as well as the point of intersection, form their respective strata. The CaSt algorithm also provides additional structural information that describes the relations between the various strata. For instance, the CaSt algorithm encodes the fact that the two circle strata (green and blue) in Figure 4 are connected by the vertex strata (red).
The mathematics behind the algorithm is described in our publication and will not be discussed in-depth here. We will be content instead to explain the CaSt algorithm at a high-level. Roughly speaking, the algorithm does the following to determine the canonical stratification of the dataset. First, the local shape is determined through computation of the local homology groups. Each local homology group, computed for each simplex, can be thought of as describing the shape around each simplex, as opposed to the (global) homology groups that describe the global shape of the dataset. Next, using this local shape information, neighboring simplices are grouped together in a process reminiscent of a connected components analysis. More precisely, the algorithm iteratively groups neighboring simplices that have local homology groups that are equal to that of a topological sphere of equal dimension. This constitutes the topologically-based clustering procedure alluded to above.
3. Conclusion
From the viewpoint of XAI, stratification adds a new set of AI algorithms to make human-relatable decisions. For example, it can produce results like “the dataset can be divided into group 1 with shape A and group 2 with shape B”, and such a result can be used to make decisions with explanations like “the new data point is part of group 1 because it lies on shape A”. In this way, AI algorithms using TDA with stratification can have its decisions be justified in terms of shapes.
The justifiable decisions of XAI allow for a human to do spot-checks on the algorithm. This will help avoid problematic situations like the copyright notice and the horse that we pointed out earlier. In essence, XAI allows us to do QA on the work delegated to the AI, and as with any product, a good QA program helps us put trust in the quality of the work. As more and more decisions come to be made by machines, having this trust will prove to be crucial. By advancing XAI through stratification and TDA, we hope to help build this trust in machine-made decisions.